Education
Simulating Ocean Currents from One Equation
The Gulf Stream, Kuroshio Current, and Antarctic Circumpolar Current all emerge from a single equation. I built a GPU-accelerated simulator that lets you watch it happen in real time — and reshape the continents while it runs.
24 April 2026 · 8 min read
What is the AMOC?
The Atlantic Meridional Overturning Circulation — the AMOC — is one of the most important systems on Earth that most people have never heard of. It’s a vast conveyor belt of ocean currents that carries warm water from the tropics northward through the Atlantic. When that water reaches the North Atlantic, it cools, becomes denser, sinks to the deep ocean, and flows back south. This circulation is what gives Western Europe its mild climate — London sits at the same latitude as Calgary, but rarely sees -30°C winters.
The AMOC is weakening. As Greenland’s ice sheet melts, freshwater floods the North Atlantic and dilutes the salty water that needs to sink. A 2023 study in Nature Communications by Peter and Susanne Ditlevsen estimates the AMOC will collapse around 2057, with 95% confidence the tipping point falls between 2025 and 2095. A more recent paper in Science Advances found physics-based early warning signals confirming the system is on a tipping course. If it collapses, Europe gets dramatically colder, sea levels rise along the Atlantic coast, monsoon patterns shift, and agriculture across the Northern Hemisphere is disrupted.
I live in the Netherlands. This isn’t a distant abstraction for me — it’s the most important climate risk to the place I call home.
Climate simulations you can’t see
The problem with most climate science is that the simulations are invisible. Researchers run massive numerical models on supercomputers, producing terabytes of data that get distilled into charts and papers. The underlying physics is beautiful — the interplay of wind, rotation, and friction that produces every major ocean current — but you’d never know it from looking at a time series plot.
Reading that the Gulf Stream carries 30 sverdrups of warm water northward is abstract. Watching it form from nothing — watching the beta effect pull the flow to the western boundary, watching the boundary current intensify as you increase wind stress — makes the physics intuitive in a way that equations on a page never can.
Building it with Claude Code
In conversation with my friend Luke Barrington, director of Google Earth AI, we wanted to see what was possible in a short time with Claude Code. Could we take the barotropic vorticity equation — the single equation that governs large-scale ocean circulation — and make it run interactively in a browser?
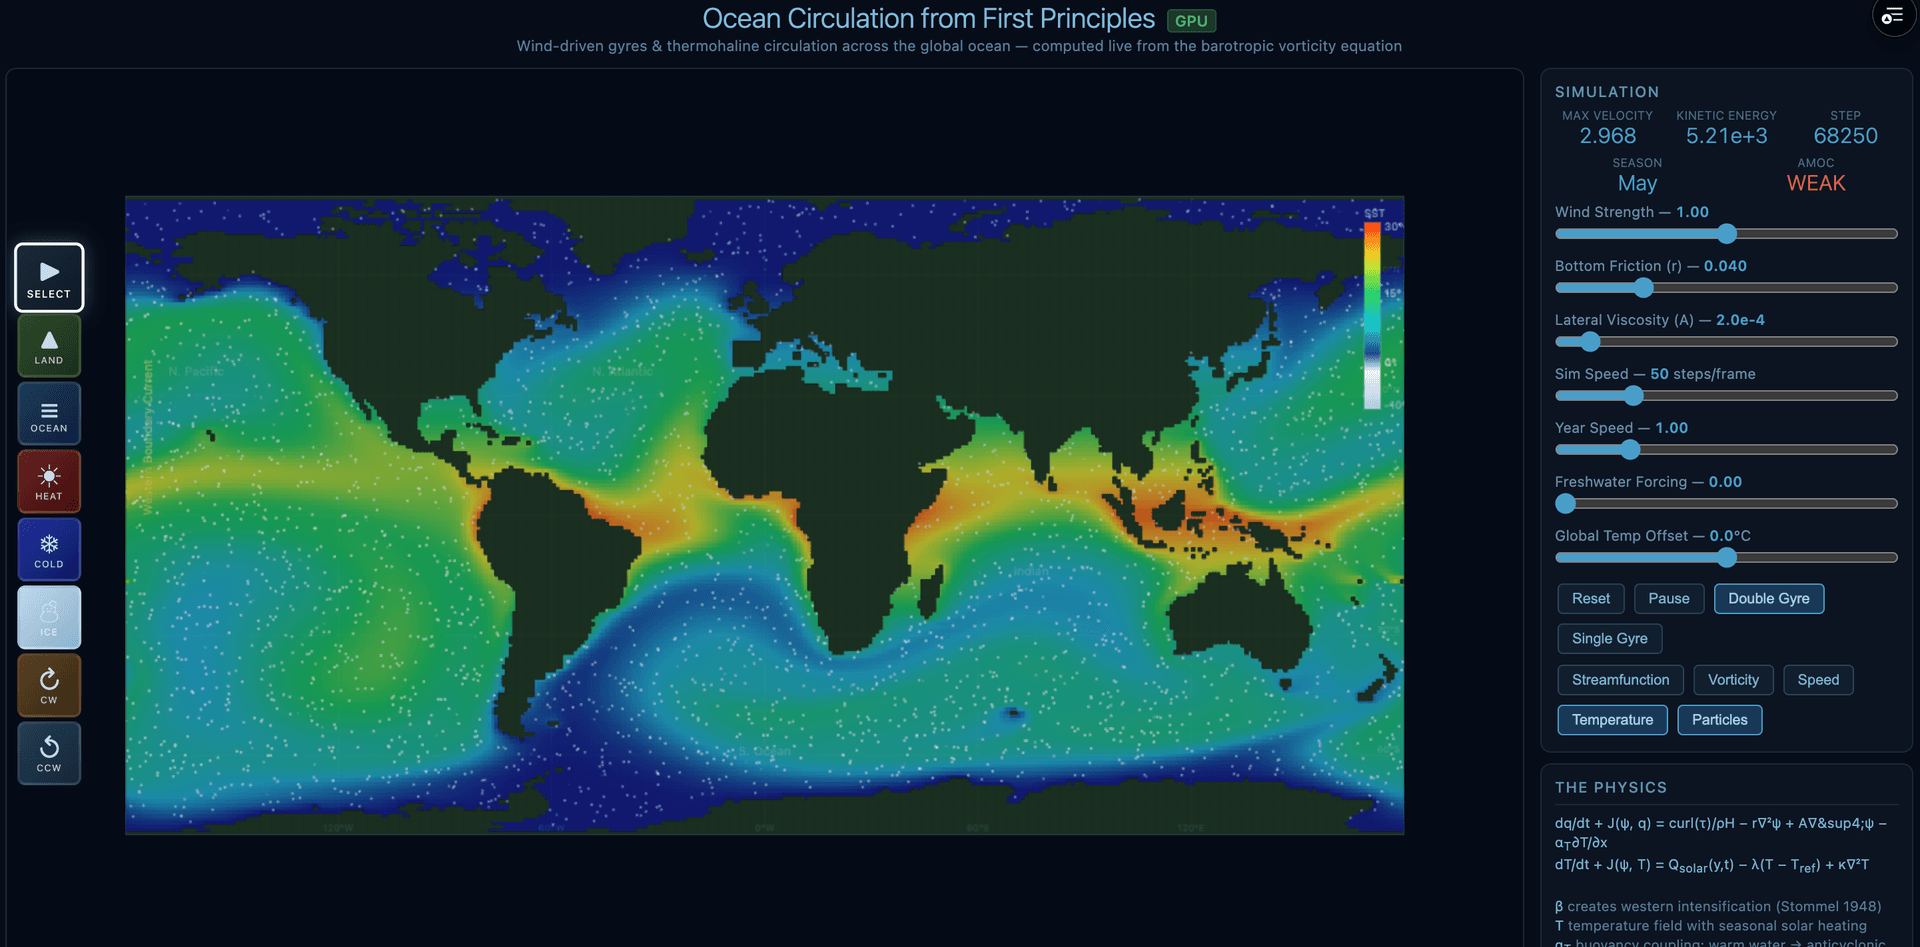
The result is a real-time simulator on a 720×320 global grid (0.5° resolution), using WebGPU compute shaders for GPU acceleration. It uses real NCEP wind stress data, NOAA observed sea surface temperatures, WOA23 salinity, ETOPO1 bathymetry, and MODIS cloud fraction — all running on the GPU with cos(latitude) metric corrections for proper spherical geometry.
One equation to rule them all
The governing equation looks intimidating at first:
dζ/dt + J(ψ,ζ) + βv = curl(τ)/ρH - rζ + A∇&sup4;ψBut each term has a clear physical meaning. Wind stress curl (curl(τ)/ρH) drives the circulation. The beta effect (βv) — the variation of the Coriolis parameter with latitude — explains why western boundary currents like the Gulf Stream are intense and narrow while eastern return flows are broad and gentle. Bottom friction (rζ) provides dissipation, and lateral viscosity (A∇&sup4;ψ) sets the boundary layer width.
Henry Stommel worked this out in 1948 with a paper that’s barely four pages long. Walter Munk refined the viscous formulation in 1950. Between them, they explained why every ocean basin on Earth has the same asymmetric pattern: a fast, narrow western boundary current and a slow, broad return flow.
I built an interactive equation explainer that breaks down each term with animations and physical intuition, so you don’t need a fluid dynamics background to understand what’s happening.
SimEarth for the ocean
The most fun feature is the paint palette. You can draw land or ocean directly on the map and watch the circulation reorganize in real time. Paint a land bridge across the Drake Passage and the Antarctic Circumpolar Current collapses. Open a seaway through Panama and water flows between the Atlantic and Pacific. Melt Greenland and watch the freshwater disrupt the overturning circulation.
These aren’t canned animations. The physics solver recalculates everything from scratch based on the new geometry. You’re running actual paleoclimate experiments — the same scenarios oceanographers study, just compressed from geological timescales into seconds.
Preset scenarios recreate key moments in Earth’s climate history:
- Open Drake Passage — the event ~34 million years ago that isolated Antarctica and triggered its glaciation
- Close Panama Seaway — the formation of the Isthmus of Panama ~3 million years ago that strengthened the Gulf Stream
- Melt Greenland — what happens when freshwater floods the North Atlantic
- Ice Age — expanded polar ice sheets and their effect on circulation
More than one layer
The barotropic vorticity equation gets you the currents, but the real climate story is about heat. After the first version was running, we kept pushing: a two-layer ocean with separate surface and deep water, spatially varying bathymetry, land-ocean heat exchange at coastlines, latitude-dependent seasonal insolation, outgoing longwave radiation, and ice-albedo feedback. The simulator now tracks how ice sheets reflect sunlight, how deep water stores and releases heat on longer timescales, and how the radiative balance shifts with the seasons.
A live radiative balance chart shows the energy budget by latitude — incoming solar versus outgoing thermal radiation — so you can see exactly where the planet is gaining or losing heat. It’s the kind of diagnostic that climate modelers stare at, now running interactively in a browser tab.
WebGPU makes it possible
All of this physics requires solving a Poisson equation at every timestep — a large linear system across 230,400 grid cells — plus temperature advection, salinity transport, Ekman wind-driven heat transport, radiative transfer, cloud parameterization, and ice dynamics. On CPU, this is barely interactive. WebGPU compute shaders make it smooth, running five GPU compute shaders per timestep with Red-Black SOR for the Poisson solve.
For browsers without WebGPU support, the simulator falls back to a CPU implementation. It’s slower but still functional. A badge in the corner tells you which backend you’re using.
Simulating the collapse
A freshwater forcing slider lets you simulate what happens when ice sheets melt and dilute the salty water that drives the AMOC. Push it far enough and the overturning collapses. The warm water that normally flows north from the tropics weakens, and the North Atlantic cools. With the two-layer ocean and ice-albedo feedback, you can watch the cascading effects — surface cooling triggers ice growth, which reflects more sunlight, which cools things further.
You can watch it happen in real time — the same process that scientists warn could reshape the climate of the Northern Hemisphere within our lifetimes.
AI-driven physics discovery
The next phase is using AI agents to improve the model’s physics. The simulator has a programmatic API (lab.diagnostics(), lab.setParams()) that lets autonomous agents propose parameter changes, run simulations, and measure RMSE against observed satellite data. The best configurations get submitted to a leaderboard where AI and human submissions compete.
So far, this approach has driven the temperature RMSE from 4.7°C down to 3.3°C. The model now uses variable mixed layer depth (deep in the Southern Ocean, shallow in the tropics), observed NCEP wind stress curl with Ekman heat transport, and regime-based cloud parameterization — each improvement discovered through automated parameter sweeps validated against NOAA and WOA23 observations. An AMOC strength panel compares the simulated overturning circulation against the RAPID array at 26.5°N.
The code is all client-side — no server, no API calls. Just HTML, JavaScript, and WGSL shaders. You can try it now in any modern browser.